Interpreting the graph
Here's what the graph on the home page might look like after a period of moderate rainfall:
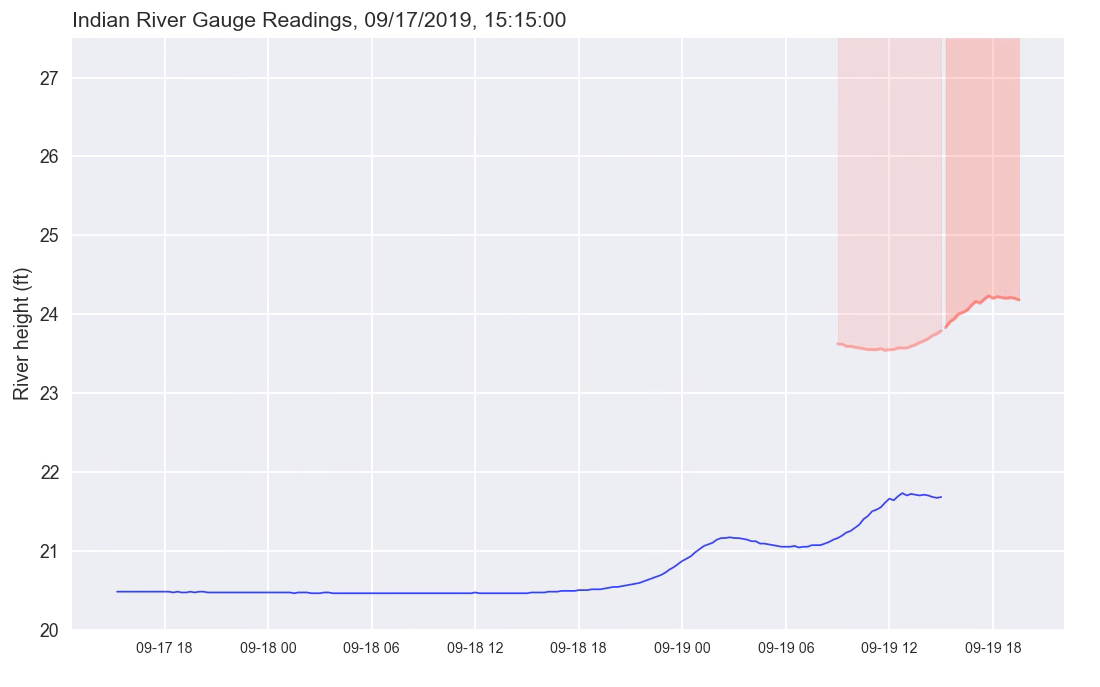
There are a few key points to keep in mind when trying to understand this graph:
- The blue line represents the height of the river.
- The red region shows how high the river would need to be at any given point to match conditions when landslide activity has occurred in the past.
- The light red region shows how close the river has been to a critical period over the last 6 hours.
- The darker red region shows how high the river would need to be to match critical conditions over the next 4.5 hours. This is not based on a weather forecast; it only shows how much the river would need to rise in the next 4.5 hours in order to be considered critical.
What does this mean?
The farther the blue line is from the red region, the farther the river is from matching historical conditions that have been associated with landslide activity. The closer the blue line gets to the red region, the closer the river is to matching historical conditions associated with landslide activity. When the blue line is in the red region, current conditions are similar to historical conditions associated with landslide activity.
In this description, "historical conditions" refers to conditions over the 6-year period from 9/2014 through 12/2020 that forms the basis for this analysis.
Why does the red region change shape?
Historically, landslide activity has been associated with sustained periods of heavy rain. During periods of moderate rainfall, a sustained period of heavy rain would still be needed to saturate the ground enough to produce slides. So, when moderate rain causes the river to rise gradually, the height associated with slide activity rises as well. Current conditions may not match historical conditions however; read the disclaimer for a more complete descripition of the limitations of this approach to landslide monitoring.
Is a landslide about to occur?
This project will never say with any certainty that a landslide is about to occur. There are simply too many factors that affect whether a landslide is about to be initiated: previous weather, current saturation levels, how localized heavy rainfall has been, temperature, wind, earthquake activity, geological factors, previous disturbance of a slope, snowmelt, and a number of other individual factors and combinations of factors. This project will only show whether current river conditions are similar to conditions when landslides have occurred during the analysis period that forms the basis of this approach.
Keep in mind that the height of the river has nothing directly to do with landslide activity; this analysis just uses the height of the river and how it changes over time to get a sense of what might be happening with soil saturation in the river's watershed.
Further reading
For more information that's helpful in understanding the graph fully see the about page, the historical examples, the description of the critical factors, and the disclaimer.