Historical examples: Medvejie slide, 9/20/2019
A landslide occurred on Green Lake Road just before the Medvejie hatchery on September 20, 2019. On that morning, Ḵaasda Héen began to rise around 7:00 am. The first critical point in this analysis occurred at 12:15 pm. It's interesting to note that this point occurred after a slight pause in the river's rise. The rate of rise had been critical before 12:15, but the total rise was not considered critical until 12:15. The slide occurred "shortly before 1:00 pm" according to a KCAW news article. This estimation of the time of the slide matches the time of the power outage that was caused by the slide.
The following image shows what this analysis would have looked like for the 48-hour period centered around this event:
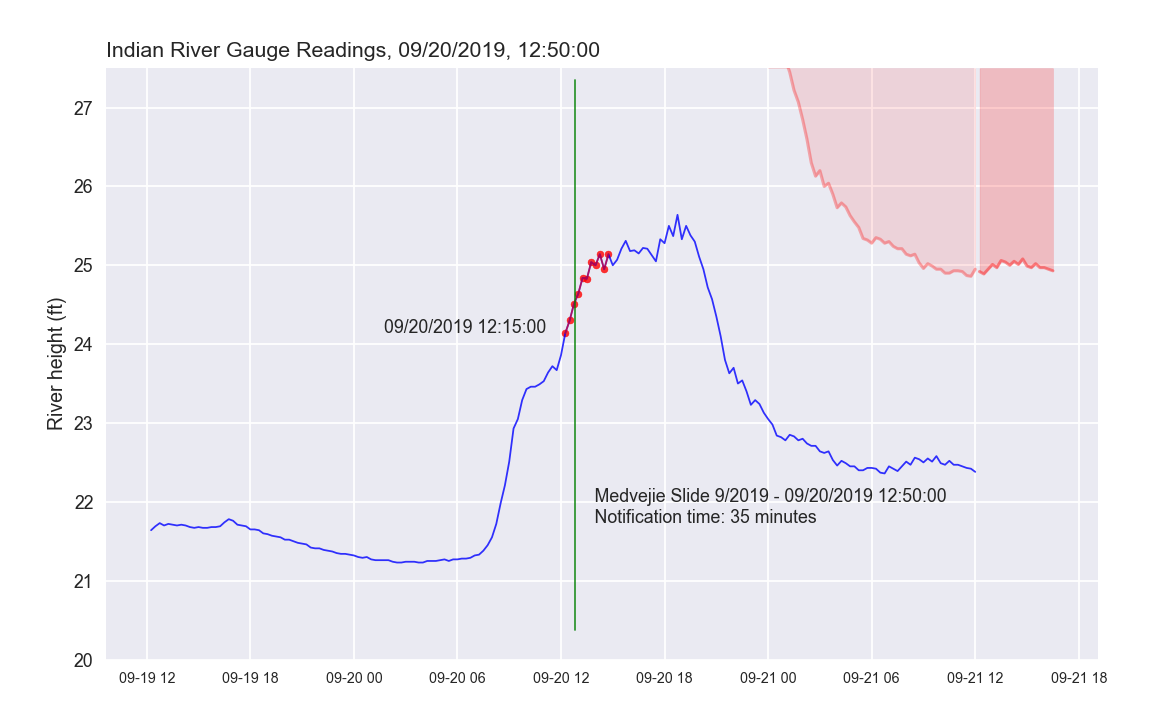
In this image, the critical points are plotted as red dots. The slide is indicated as a vertical green line at the timestamp that matches the best estimate of when the slide occurred. In this event, the slide occurred approximately 35 minutes after the river first reached a critical point.
Note that the river remained high for a number of hours after the last critical point. This usually happens when rain continues to fall at a rate that keeps the river high, but doesn't cause any further rise. This may indicate that the mountains are shedding water as fast as they are absorbing it, rather than becoming more saturated.
Here's what this visualization would have looked like in real time:
Note that the dates in the title jump from 9/18 to 9/20 at the first critical point. This is an error in the animation rendering, not an issue in the data.