Historical examples: Critical event, 9/13/2016
A critical rain event occurred on 9/13/2016, with no known associated slides. This is what the anlaysis looks like for the 48 hours centered around this event:
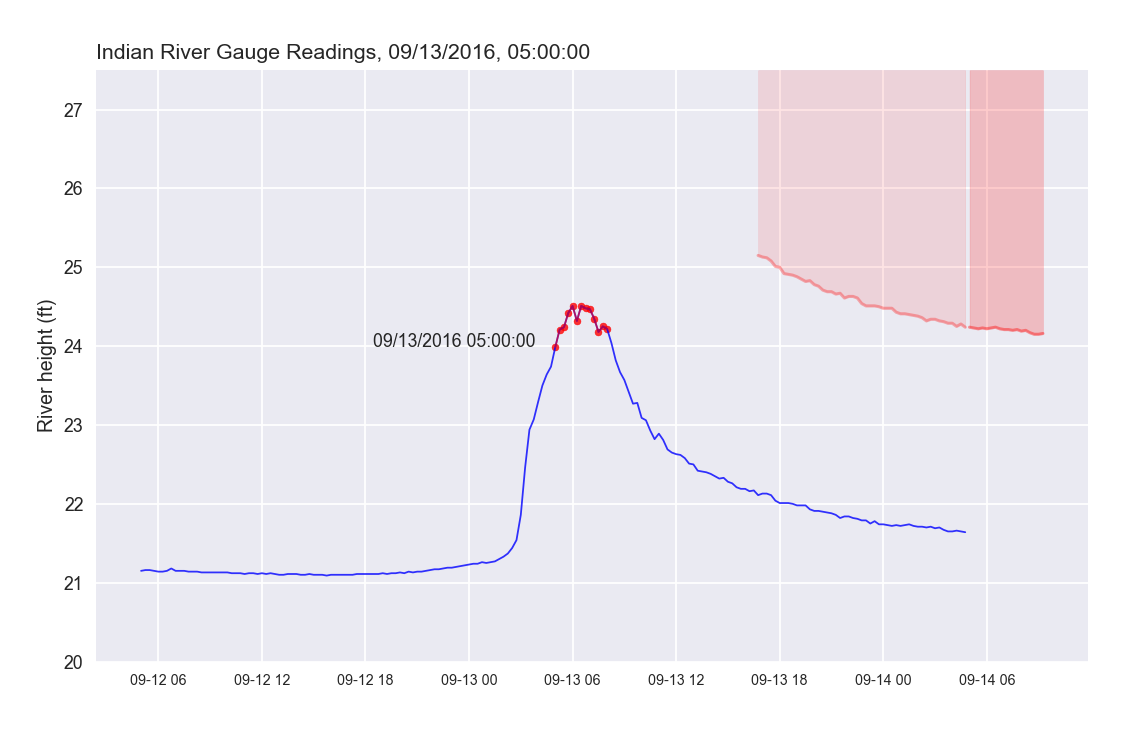
In this image, the critical points are plotted as red dots. Early in the morning on 9/13, heavy rain started to fall. The river rose steadily until around 6:00 am. The first critical point occurred at 5:00 am. The rain tapered off, and the river fell steadily after the event.
A perfect forecasting system would not flag events that don't have slides associated with them. But a perfect system is unlikely to be developed anytime soon.